AI Organizational Chart Tool
Create Clear and Effective Organizational Charts with Ease
Building an organizational chart can be time-consuming and challenging, especially when trying to represent complex team structures and hierarchies in an easy-to-understand format. However, with the right tool, creating an organizational chart becomes straightforward, and you can communicate your company’s structure clearly to both internal and external stakeholders.
That’s where Bit.ai’s Organizational Chart Tool comes in! It helps you quickly create visually appealing and well-structured organizational charts that showcase your company’s hierarchy, making it easier for everyone to understand roles and reporting lines.
Let’s explore how Bit.ai’s Organizational Chart Tool works, why it’s perfect for this task, and how it makes chart creation faster and more efficient!
What is an Organizational Chart Tool?
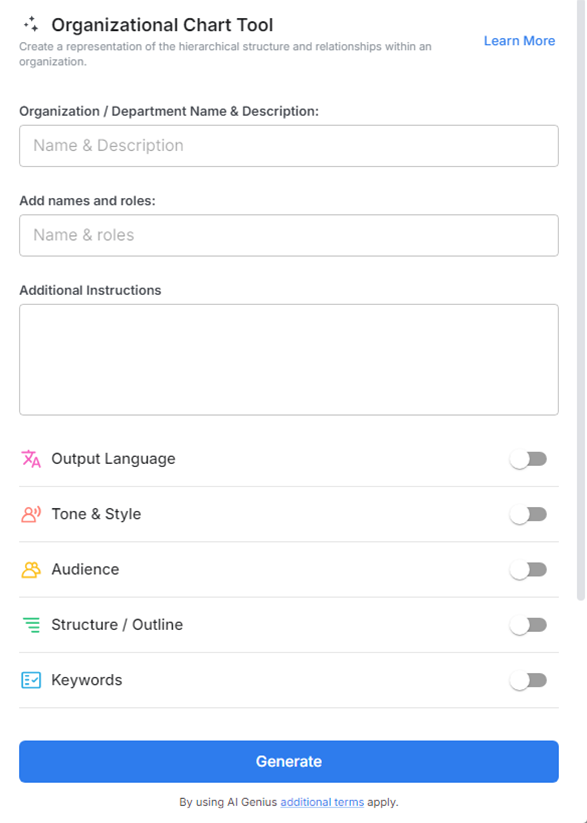
An Organizational Chart Tool is a powerful, AI-driven tool designed to help you create visual representations of your organization’s structure. Whether you’re mapping out a small team or an entire enterprise, this tool allows you to build clear charts that display roles, reporting lines, and team structures in an organized format.
Why Use an Organizational Chart Tool?
- Time-Saving: Quickly build and adjust your organizational chart, without needing to start from scratch each time.
- Clarity & Precision: Clearly display roles, relationships, and reporting structures for easy understanding by employees, partners, and stakeholders.
- Customizable: Tailor the chart to suit your organization’s specific needs, adding or removing roles as your structure evolves.
- Professional Appearance: Create clean, visually appealing charts that look polished and communicate effectively.
- Easy to Update: Easily update the chart as changes in the organization occur, ensuring that it always reflects the current state of the company.
- Streamline Communication: Share the organizational chart with team members, new hires, or investors to help them understand the company structure.
Why Use Bit.ai to Create Organizational Charts?
Bit.ai offers the perfect solution for creating and maintaining organizational charts that can be customized and shared with ease.
- Pre-built Templates: Access a variety of customizable templates specifically designed for organizational charts, saving you time.
- Real-Time Collaboration: Collaborate with your team to ensure that the organizational chart reflects the most accurate and up-to-date information.
- Customizable Layouts: Use drag-and-drop functionality to add and adjust roles, reporting lines, and design elements.
- Professional Look: Create a clean, visually organized chart that’s easy to read and share with others.
- Multimedia Support: Enhance the chart with photos, role descriptions, or links to make it more informative.
- All-in-One Platform: Keep all your charts, documents, and related resources in one place for easy access and sharing.
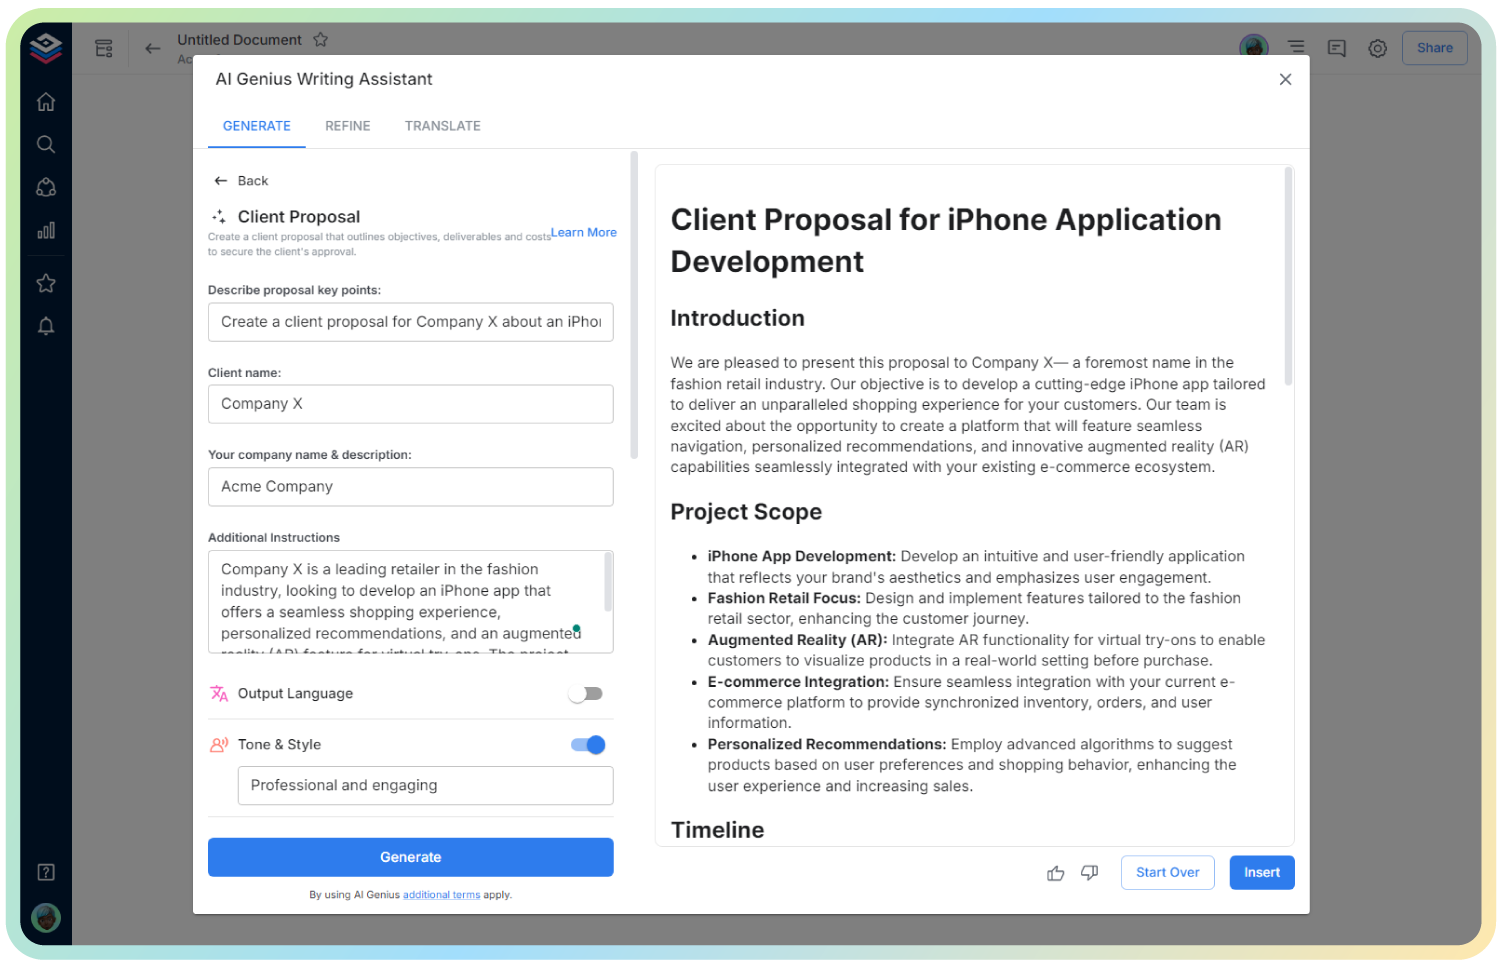
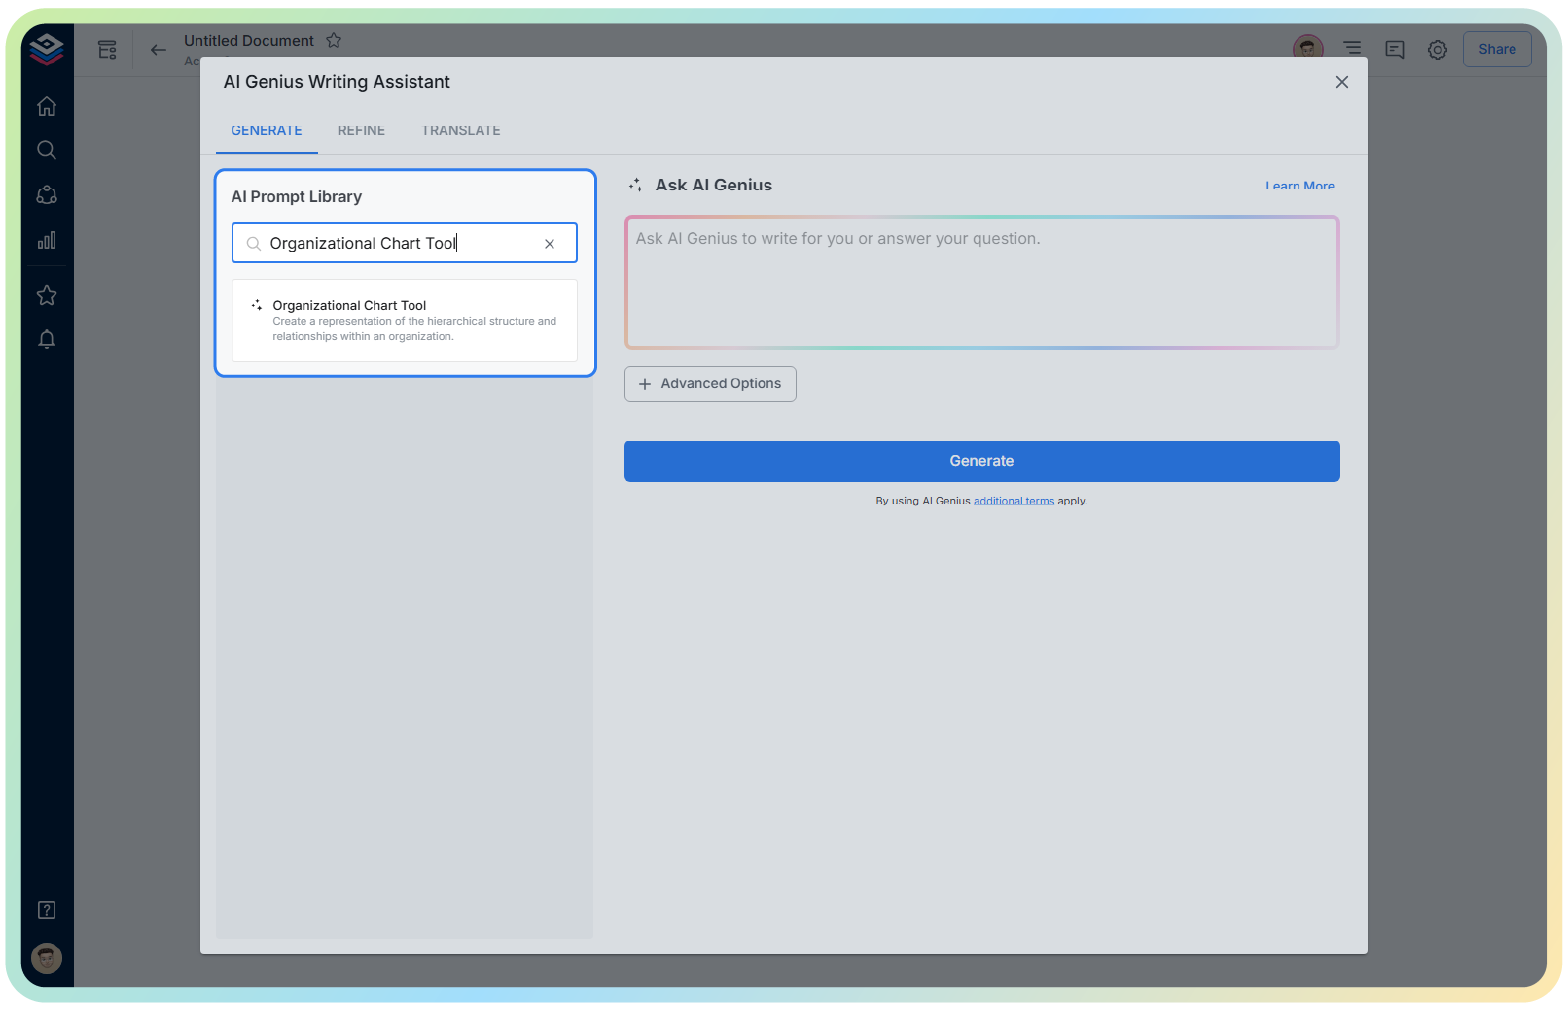
How to Use Bit’s Organizational Chart Tool
1. Open a new document in Bit.ai.

2. Type @ on a blank line to open up the AI Writing Assistant.

4. Fill out the quick Instagram Post Generator entry form, and Bit.ai will generate a customized post.

5. Customize the chart by adding roles, departments, and reporting lines. Use drag-and-drop functionality to arrange positions.

6. Once your chart is complete, click ‘Insert,’ and it will be added directly into your Bit document for further editing or sharing.